CMSC320 Students and the Stock Market
If you torture the data long enough, it will confess to anything
— Ronald Coase
Introduction
After long hours considering Max's statements on stock trading I came to the realization that I had one piece of information wallstreet could not dream of... attendance data for Prof. Morawski's CMSC320 lectures. So as every sane human being would I used Yahoo finance's API to fetch the closing price history of 726 of the most commonly traded stocks and searched for correlation with attendance data.
Monday Wednesday Stock Correlations
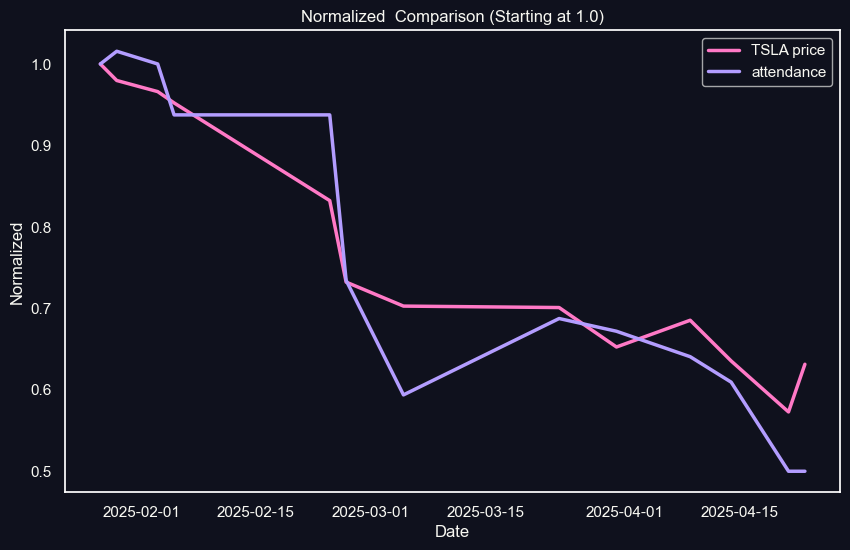
I(pandas) went through each of the 720 stocks mentioned above and the stock with the highest correlation to the Monday/Wednesday class was Tesla with a correlation of 0.963. Here's a chart of both of their trendlines normalized so that each of their starting values is adjusted to 1.
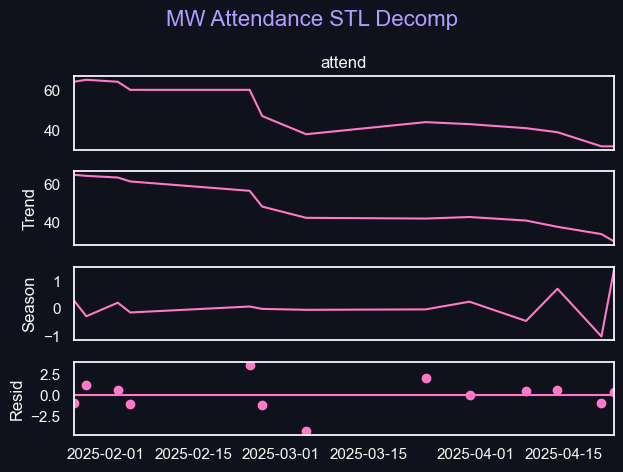
Here's an STL Decomposition of the data for the Monday Wednesday Class. As you can see there's steady attendance then a drop then a slow downward trend.
Investment Takeaways
As far as I see it there are three main ways to view this: one is that the CMSC320 students in the Monday/Wednesday are TSLA options traders who go to class based on stock performance, the second that the price of the worlds most valuable car company heavily relies on class attendance and the third is that this was just random chance. Since I have faith that my fellow students are only motivated by their education the only real option is that the students are unwittingly more important to Tesla's stock price than Elon Musk.
Tuesday Thursday Stock Correlations
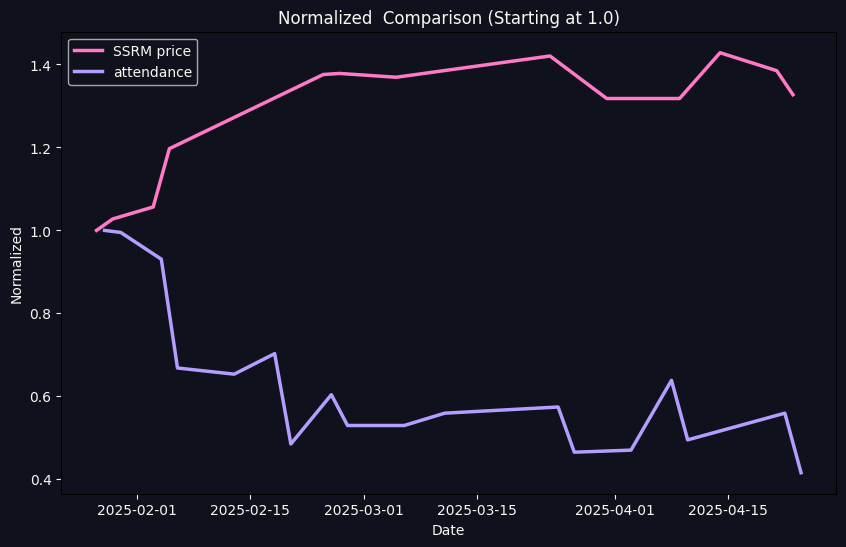
Unlike the Monday/Wednesday class, the Tuesday/Thursday class had a negative correlation as its highest absolute value. In this case SSR Mining. Here's the trends compared.
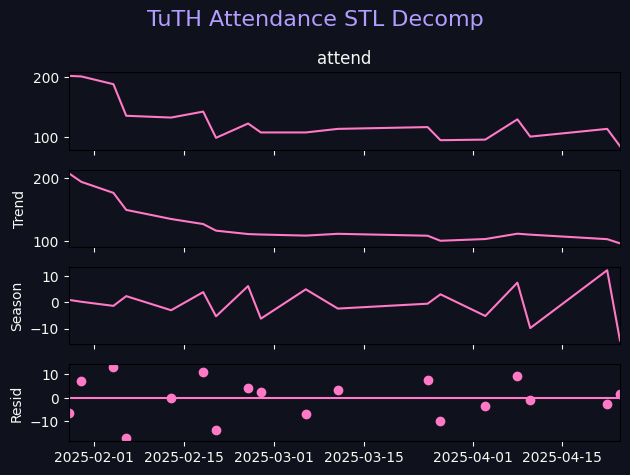
Here's the STL Decomposition for the Tuesday/Thursday class. As you can see, for this class the downward trend is more steady with most of the drop off happening earlier.
Adjusting for Trends
A common response to the above takeaways might be that these comparisons are dominated by overarching trends, which is fair. However, interestingly enough after applying a linear detrend to all data, the highest pearson correlation for the Monday/Wednesday class continues to be an electric car company. In this case, Lucid motors.
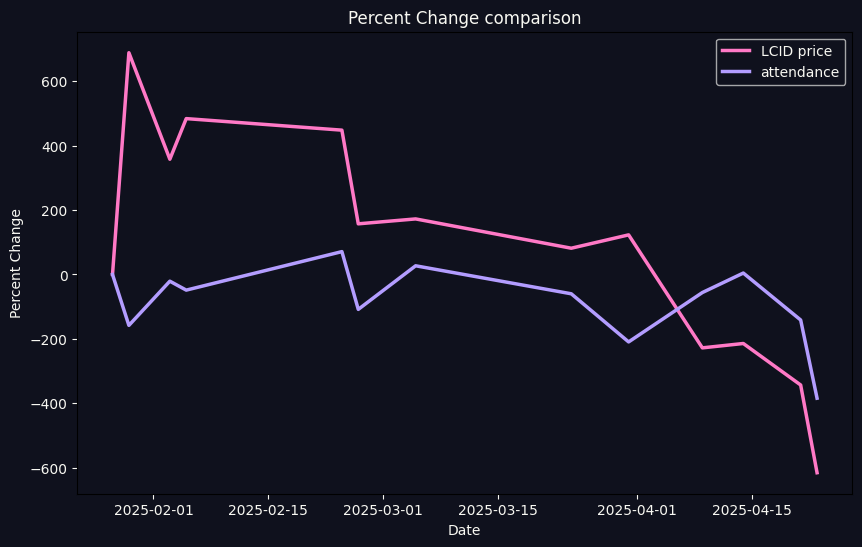
For the Tuesday/Thursday class the highest absolute value correlation after detrend is a negative correlation with ACADIA Pharmaceuticals Inc which is not as interesting.
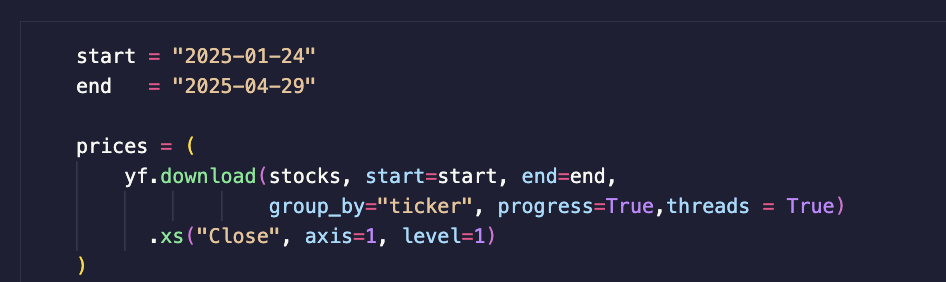
Methods
I got the stocks from Nasdaq's stock screener and then data from Yahoo's API. Stock/attendance correlations were calculated by creating date indexed dataframes on the dates where attendance data was available. Then I just used pandas .corr() method and took the highest.
For legal reasons this is not investment advice